OpenLIT Integration via OpenTelemetry
Langfuse is an OpenTelemetry backend, allowing trace ingestion from various OpenTelemetry instrumentation libraries. This guide demonstrates how to use the OpenLit instrumentation library to instrument a compatible framework or LLM provider.
Step 1: Install Dependencies
Install the necessary Python packages: openai, langfuse, and openlit. These will allow you to interact with OpenAI as well as setup the instrumentation for tracing.
%pip install openai langfuse openlitStep 2: Configure Environment Variables
Before sending any requests, you need to configure your credentials and endpoints. First, set up the Langfuse authentication by providing your public and secret keys. Then, configure the OpenTelemetry exporter endpoint and headers to point to Langfuse’s backend. You should also specify your OpenAI API key.
import os
import base64

LANGFUSE_PUBLIC_KEY = "pk-lf-..."
LANGFUSE_SECRET_KEY = "sk-lf-..."
LANGFUSE_AUTH = base64.b64encode(f"{LANGFUSE_PUBLIC_KEY}:{LANGFUSE_SECRET_KEY}".encode()).decode()

os.environ["OTEL_EXPORTER_OTLP_ENDPOINT"] = "https://cloud.langfuse.com/api/public/otel" # 🇪🇺 EU data region
# os.environ["OTEL_EXPORTER_OTLP_ENDPOINT"] = "https://us.cloud.langfuse.com/api/public/otel" # 🇺🇸 US data region

os.environ["OTEL_EXPORTER_OTLP_HEADERS"] = f"Authorization=Basic {LANGFUSE_AUTH}"

# Set your OpenAI API key.
os.environ["OPENAI_API_KEY"] = "sk-proj-..."
Configure tracer_provider and add a span processor to export traces to Langfuse. OTLPSpanExporter() uses the endpoint and headers from the environment variables.
from opentelemetry.sdk.trace import TracerProvider
from opentelemetry.exporter.otlp.proto.http.trace_exporter import OTLPSpanExporter
from opentelemetry.sdk.trace.export import SimpleSpanProcessor

trace_provider = TracerProvider()
trace_provider.add_span_processor(SimpleSpanProcessor(OTLPSpanExporter()))

# Sets the global default tracer provider
from opentelemetry import trace
trace.set_tracer_provider(trace_provider)

# Creates a tracer from the global tracer provider
tracer = trace.get_tracer(__name__)
Explanation: This block configures the necessary environment variables. The Langfuse keys are combined and base64 encoded to form an authentication token that is then set in the OTLP headers. Additionally, the OpenTelemetry endpoint is provided to direct trace data to Langfuse’s backend.
Step 3: Initialize Instrumentation
With the environment set up, import the needed libraries and initialize OpenLIT instrumentation. We set tracer=tracer to use the tracer we created in the previous step.
import openlit

# Initialize OpenLIT instrumentation. The disable_batch flag is set to true to process traces immediately.
openlit.init(tracer=tracer, disable_batch=True)
Step 4: Make a Chat Completion Request
For this example, we will make a simple chat completion request to the OpenAI Chat API. This will generate trace data that you can later view in the Langfuse dashboard.
from openai import OpenAI

# Create an instance of the OpenAI client.
openai_client = OpenAI()

# Make a sample chat completion request. This request will be traced by OpenLIT and sent to Langfuse.
chat_completion = openai_client.chat.completions.create(
    messages=[
        {
          "role": "user",
          "content": "What is LLM Observability?",
        }
    ],
    model="gpt-3.5-turbo",
)

print(chat_completion)
Step 5: Pass Additional Attributes (Optional)
Opentelemetry lets you attach a set of attributes to all spans by setting set_attribute. This allows you to set properties like a Langfuse Session ID, to group traces into Langfuse Sessions or a User ID, to assign traces to a specific user. You can find a list of all supported attributes in the here.
import openai
with tracer.start_as_current_span("OpenAI-Trace") as span:
span.set_attribute("langfuse.user.id", "user-123")
span.set_attribute("langfuse.session.id", "123456789")
span.set_attribute("langfuse.tags", ["staging", "demo"])
span.set_attribute("langfuse.prompt.name", "test-1")
# You application code below:
response = openai.OpenAI().chat.completions.create(
messages=[
{
"role": "user",
"content": "How does enhanced LLM observability improve AI debugging?",
}
],
model="gpt-4o-mini",
)
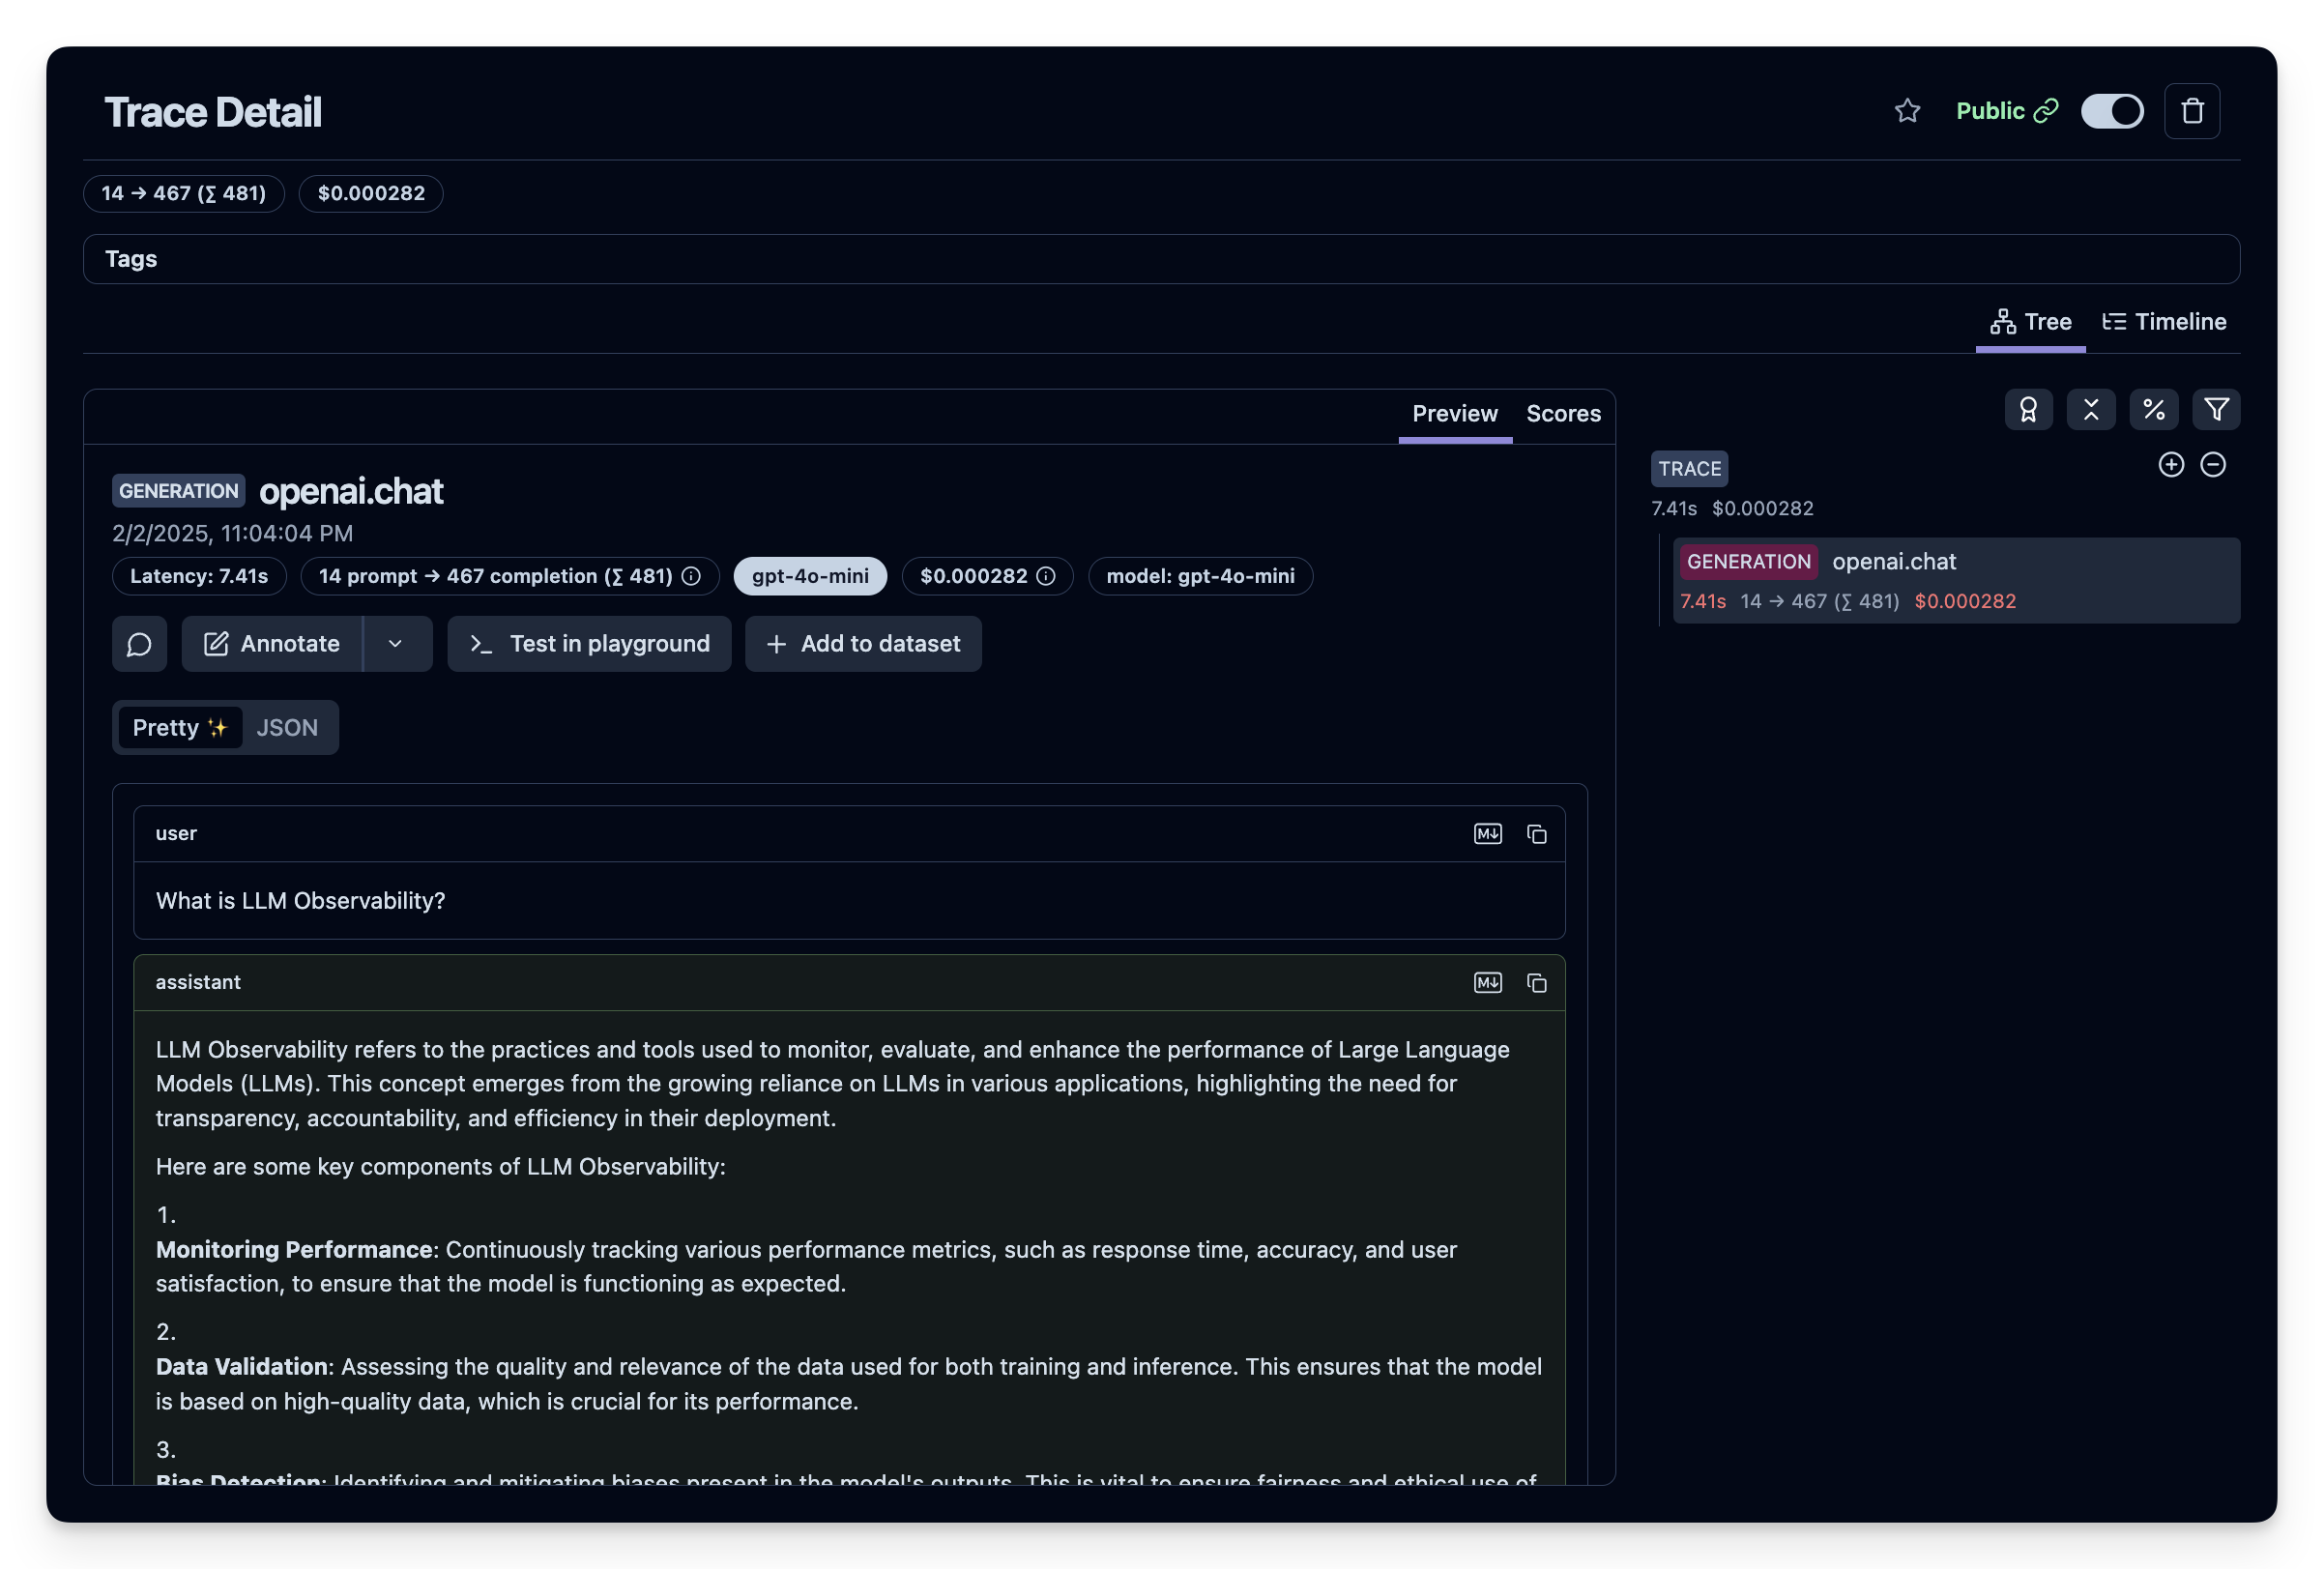
print(response.choices[0].message.content)Step 6: See Traces in Langfuse
You can view the generated trace data in Langfuse. You can view this example trace in the Langfuse UI.